Can you bake Maven into a neural network?
We tried, and it builds. We compiled the decision making part of a Maven style build tool into a fixed weight matrix and used it to build a real Java library. The output matches Apache Maven& x27;s byte for byte. A clean build with tests took 1.49× as long as the same logic written in Python (95% interval [& 8230;]

We tried, and it builds. We compiled the decision-making part of a Maven-style build tool into a fixed weight matrix and used it to build a real Java library. The output matches Apache Maven's byte for byte. A clean build with tests took 1.49× as long as the same logic written in Python (95% interval 1.4× to 1.54×, 30 paired runs).

The network’s weight table, one bar per row. Bar height is how often a row ran during one ZXing build; the bright point replays real stretches of that build, one step at a time.
Every Java developer has watched Maven think. It resolves, compiles, tests and packages. Most of that time belongs to javac and JUnit, but threaded through it is a small, fussy piece of logic that decides what happens next. Which version of a library wins when two modules disagree. Which files go to the compiler, and with which flags. Whether a failing test stops the build.
We wanted to know if that piece could live inside a neural network. Not a model trained to guess what Maven usually does next: that kind of model is right most of the time, and a build tool that is right most of the time is broken. We wanted the decision logic itself, compiled into weights, so the network gets the answer exactly right or refuses to answer.
The video at the top of this post is that network. Each of its 26,626 bars is one row of its weight table (model nmvn-exact-v2, explained in the section on making it cheaper), bar height is how often that row ran during one ZXing build, and the bright point replays real stretches of that build, one step at a time. Everything that decides how the build goes is in there.
From a program to a weight table
The trick comes from Handwired: you can write a program and then set a network’s weights so the network is that program. We wrote a small Maven-compatible build controller in a restricted subset of Python and compiled it into a table of 29,625 × 7 numbers, plus 7,382 cells of constants (that’s the first version, v1; a later section shrinks the table to the 26,626 rows you see above). No training, no gradient descent: zero optimizer steps.
Running it is a loop. Each step, the network looks up one row of its table with two matrix multiplications, does the arithmetic that row encodes on a small register file, and writes the result back to memory. The network can’t open files or start javac. When it needs to, it writes a request into a fixed slot in its memory, and a thin bridge carries the request out and writes back the raw answer. The bridge never decides anything. Every choice comes out of the weights.
The test subject was ZXing 3.5.3, the barcode library: its parent project and the core and javase modules, built with clean package and the tests on.
Does it actually build?
Yes. The JARs it produced match Apache Maven’s byte for byte, built inside a sandbox where Maven can’t run, the network is off, and neither the Python version of the logic nor Maven’s own outputs can be read. All 549 upstream tests ran and passed, and the freshly built JARs encoded and decoded QR codes correctly in 27 of 27 checks.
519hand-written build cases passed, each checked against real Maven
10,000generated project cases passed
33other small projects built correctly with the same weights
4,796,191network steps for one full ZXing build
Two checks convinced us the work really happens in the weights. The CPU and GPU versions of the network made exactly the same 1,731 requests, in the same order, for a full build. And when we deleted or corrupted the weight file, no build happened at all.

A QR code written by the freshly built ZXing JARs and read back by them.
Watch it build
Left: the controller as ordinary Python. Right: the same controller as a neural network. Both build ZXing for real, one after the other on the same Mac, played back at real speed.
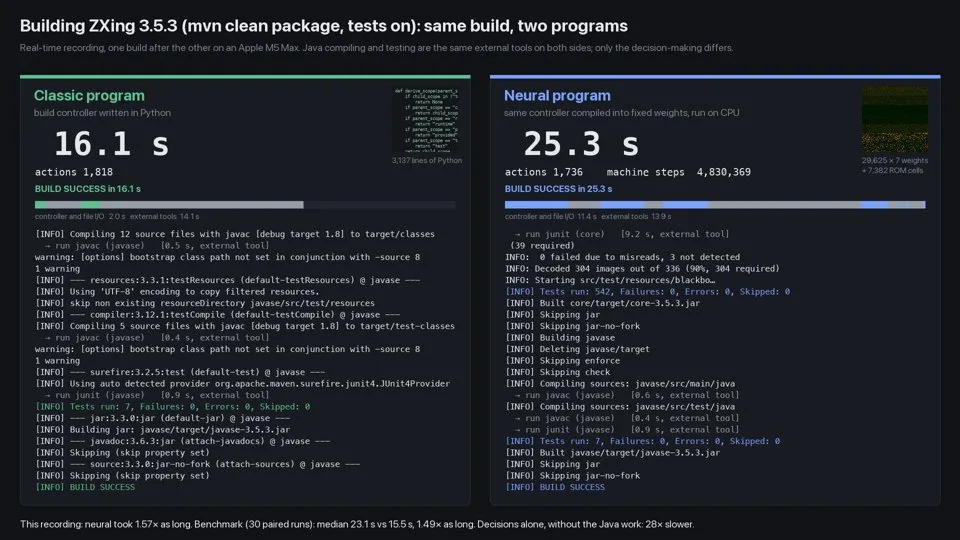
One recorded build on each side, played back in real time. Grey on the timelines is time spent in javac, JUnit, bnd and zip.
The bill
It’s slower, in every scenario we measured. Python runs the controller’s logic directly; the network spends a full round of matrix arithmetic on every tiny instruction, and one ZXing build costs it 4,796,191 of them.
| What was timed | Classic Python | Neural, CPU | Neural, GPU (Metal) | Apache Maven 3.9.11 | Neural CPU / Python |
|---|---|---|---|---|---|
| Decisions only (no Java work) | 146.54 ms | 4.15 s | 27.97 s | – | 28.3× |
| Cold start to first decisions | 385.94 ms | 4.80 s | 28.25 s | – | 12.4× |
| Clean build with tests | 15.52 s | 23.12 s | 70.11 s | 15.29 s | 1.49× |
| Build that stops at a compile error | 1.74 s | 4.41 s | 22.19 s | 2.81 s | 2.53× |
Median wall time (lower is better). Last column: neural CPU time divided by Python time.
Clean build with tests, median seconds. Bar = median; whisker = p25 to p75.
On decisions alone the network is far behind. In a whole build the gap shrinks to about one and a half times, because most of the time goes to javac and JUnit and both versions use the same ones. Running the network on the GPU made things worse, not better. A program that executes one instruction after another gives a GPU nothing to do in parallel.
So this is not a faster build tool. It’s a build tool you can hold as a tensor.
Making it cheaper without touching the network
The time is roughly steps × cost per step, so we counted where the steps go. We replayed a full ZXing build in an instruction-level simulator and tallied every instruction it executed. Of v1’s 4,796,191 steps, 652,773 (14%) just copied a value from one register to another, and 553,333 more (12%) loaded a constant or jumped back to the top of a loop. That’s compiler glue, not build logic.
So we left the network alone and fixed the compiler. Results now land directly in the register that needs them, constants ride inside the instruction that uses them, conditions compile straight to branches, and loops test at the bottom instead of jumping back to the top. The machine, its step graph and the GPU kernel are unchanged. Only the table of numbers is different, and smaller.
**23%**fewer network steps for a full ZXing build (4,796,191 → 3,676,728)
**10%**fewer rows in the weight table (29,625 → 26,626)
identicaldecisions: fed v1’s recorded inputs, v2 makes the same 1,731 requests in the same order, on CPU and GPU
2 of 2correctness gates re-passed by v2 (same suites, sandboxed build, byte-identical JARs)
Every step of one full ZXing build, by instruction class (instruction-set simulator replaying the recorded build; the action sequence is identical for both models).
| What was timed | Neural CPU, v1 | Neural CPU, v2 | Python (v2 run) | v1 / Python | v2 / Python (95% CI) |
|---|---|---|---|---|---|
| Decisions only (no Java work) | 4.15 s | 3.40 s | 140.81 ms | 28.3× | 24.2× (23.6× to 25.2×) |
| Cold start to first decisions | 4.80 s | 4.14 s | 402.38 ms | 12.4× | 10.3× (10.1× to 10.7×) |
| Clean build with tests | 23.12 s | 21.09 s | 14.83 s | 1.49× | 1.42× (1.40× to 1.43×) |
| Build that stops at a compile error | 4.41 s | 3.70 s | 1.78 s | 2.53× | 2.08× (2.05× to 2.11×) |
Neural CPU, v1 vs v2 (median wall time). Ratios are neural time / Python time from paired runs in the same session; v1 from nmvn-bench-v0, v2 from the follow-up protocol.
The GPU gains more, because it pays almost purely per step: decisions only took 27.97 s with v1 and 21.61 s with v2 (23% less), close to the cut in steps. It is still the slowest engine.
We re-ran the whole correctness chain on the new weights: every test suite, the sandboxed build that has to produce byte-identical JARs, the negative controls and the CPU/GPU replay. The cut is real but modest where it counts. Java tooling still owns most of a full build, so trimming the network’s share moves the end-to-end number less than the step count suggests.
It isn’t only Maven
To check the compiler isn’t secretly tuned to one program, we gave it something unrelated: a maze solver (breadth-first search, programs/maze/maze_nml.py). It compiled to 279 rows of weights. A small app starts the classic and the neural version at the same moment, as separate processes, and draws each cell as soon as that program reports it.
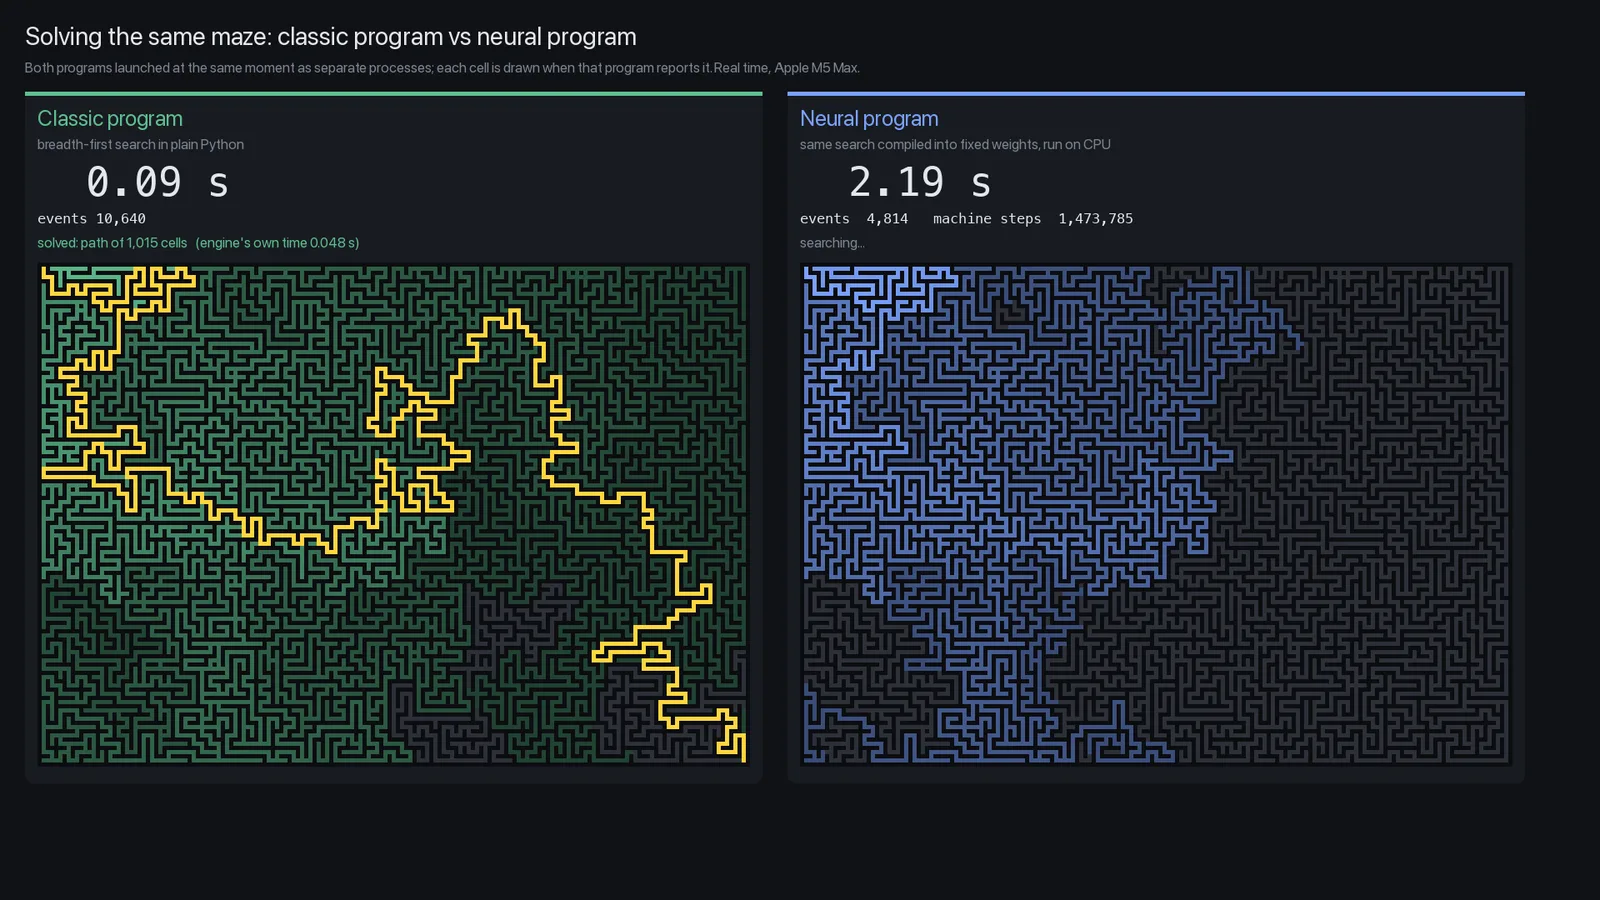
Recording of the app window, which saves its own frames as it runs;, neural side on CPU. The GPU version takes longer.
On 3 different 171×121 mazes, plain Python, the Python debug shim, the neural CPU run and the neural GPU run produced identical event sequences: every visited cell, in the same order, with the same distances. The first maze took 2,572,288 network steps. Neural on CPU took 161× to 168× as long as plain Python, and on GPU 791× to 812× (each program’s own timer, one run per maze, so treat these as rough).
So it’s slower. Is it even useful?
Fair question. We asked it too. If you want a faster build, no: keep using Maven. And a bigger GPU won’t rescue it, because the network runs one instruction at a time and nothing in a build controller can be spread across thousands of cores.
Speed was never the interesting part, though. What we ended up with is a neural network where every weight has a known meaning, and that is rare. Here’s where we think it’s worth something, most convinced first.
An answer key for people who take networks apart
Interpretability research tries to work out what a network does from its weights alone. The hard part is grading the answer, because for a trained model nobody knows the truth. This network ships with the truth. Apart from a seven-row start-up stub, every one of its 26,626 rows belongs to a known function among the controller’s 249, and we know what each of those functions does. So we can point at the rows of do_surefire, the part that runs the tests and decides whether a failure stops the build. If a tool claims to have found “the dependency-resolution circuit”, you can check it. Hand-built test networks tend to be small toys. This one does a real job on a real codebase, and we think that’s its best use.
Exact parts inside models that guess
A model that picks the right library version 99% of the time is wrong once every hundred builds. Compiled weights are a way to put an exact subroutine in the same form as a learned model: same tensors, same runtime, same hardware. To be clear, we haven’t joined one to a trained model. That’s the next experiment, not a result. It’s the direction we find most exciting all the same.
Decision logic you can hash
The whole policy is one file of numbers. Move it from CPU to GPU and it makes the same 1,731 decisions in the same order; feed it a recorded build and it replays it exactly. That’s how we compared v1 and v2 decision by decision in the section on making it cheaper. You can diff it, sign it, and show that a given build came from it. In fairness, ordinary code with a lockfile gets you most of the way. What the tensor version adds is that the thing running the policy is the same fixed loop of lookups and arithmetic for any program you compile into it, and a smaller runtime is a smaller thing to trust.
One more thing in its favour: the cost shrinks when the decisions are a thin layer over heavy tools. In a full ZXing build, javac and JUnit do most of the work, which is why the network costs about one and a half times the Python time there instead of twenty-odd times. Glue logic around expensive steps pays that same modest price.
Wrong tool for
- Faster builds, or anything where milliseconds matter
- Throwing more GPU at the problem
- Replacing Maven
Worth a look for
- Testing interpretability tools against a network with a known answer
- Exact subroutines living next to learned models
- Decision logic you can hash, replay and compare
What we’re not claiming
- This isn’t all of Maven. It handles one build (
clean package) of one real project, with Enforcer, Checkstyle, Javadoc and source JARs skipped. Signing, deployment and everything that only runs inverifyare out of scope. The plugins aren’t neural: javac, JUnit, bnd and zip run as ordinary programs. - This isn’t machine learning. The weights were compiled from a program, not learned. We didn’t try a trained version, and we’d expect one to fail on projects it hadn’t seen.
Check our work
The weights, the runtime and the full results are on Hugging Face at shirman/neural-maven: the method, all eleven scenarios, memory use, the environment and evidence hashes, plus the raw measurements, both protocols, the analysis code and checksums. That’s enough to recompute every number in this post.
Originally published on
JetBrains AI
Keep reading





 Vercel Blog
 Vercel Blog