Grafana Tempo 3.1 Adds Query-Based Trace Redaction and Sampling-Aware TraceQL Metrics
Grafana Labs has released Tempo 3.1, the first minor update to the 3.0 architecture. It adds TLS and additional SASL mechanisms to the Kafka client, lets operators redact traces with a TraceQL query instead of a list of trace IDs, and introduces an experimental query time hint that corrects TraceQL metrics for…

Grafana Labs has released Tempo 3.1, the first minor update to the 3.0 architecture. It adds TLS and additional SASL mechanisms to the Kafka client, lets operators redact traces with a TraceQL query instead of a list of trace IDs, and introduces an experimental query-time hint that corrects TraceQL metrics for sampled data. vParquet5 also becomes the default block format. According to Grafana, simple metrics queries now run close to twice as fast.
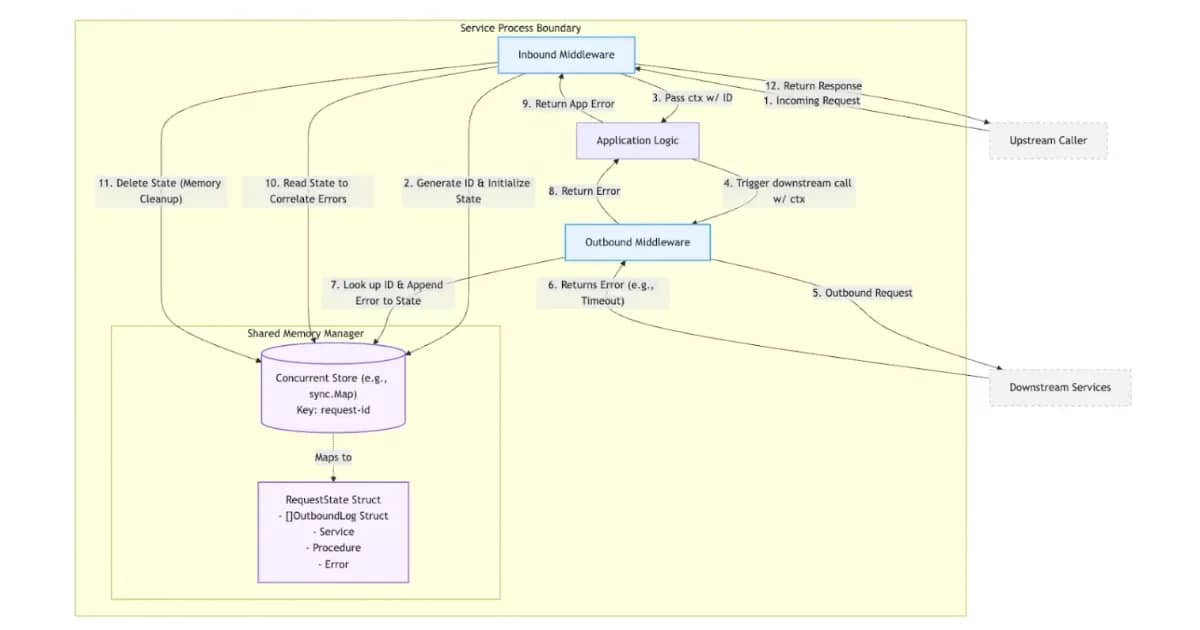
The release builds on Tempo 3.0, published in June, which made the Kafka-compatible architecture (codenamed Project Rhythm) the default for microservices deployments. In that design, distributors write to a Kafka topic. Block-builders consume the topic to write Parquet blocks to object storage, and live-stores consume it to serve recent traces. Ingesters and compactors are gone, replaced by a backend scheduler and workers. Grafana says dropping replication factor 3 reduces storage from 3 to 3.5 times the trace volume to a single copy. Monolithic mode remains Kafka-free.
Because Kafka is now on the critical path, the 3.0 client's limits became a problem. It supported only SASL
PLAIN
over an unencrypted connection, so any broker requiring TLS refused it. Tempo 3.1 adds TLS, including optional mTLS, plus
SCRAM-SHA-256
,
SCRAM-SHA-512
,
OAUTHBEARER
, and
AWS_MSK_IAM
. A new
client_rack
option enables rack-aware fetching (KIP-392), so block-builders, live-stores, and metrics-generators can read from a replica in their own availability zone and avoid cross-zone transfer charges. It requires brokers with rack IDs configured. A new
producer_compression
option accepts
none
,
gzip
,
snappy
,
lz4
, or
zstd
; unset, it defaults to snappy. Grafana notes that this, together with TLS, makes Azure Event Hubs usable as a backend, since it accepts only gzip. All three changes came from community contributors.
Trace redaction, introduced in 3.0 through tempo-cli redact, previously required enumerating trace IDs. Sensitive values such as tokens or account numbers often appear across more traces than can practically be listed. In 3.1 the command takes a TraceQL query and supports
--dry-run
, which counts matches without modifying blocks. Grafana limits the syntax to one spanset filter. It uses equality comparisons on
resource.*
and
span.*
attributes, along with
&&
and
||
. This is because the rewrite cannot be undone.
--start
and
--end
flags narrow the time range, which matters because Tempo pauses compaction for a tenant while a redaction applies. Grafana warns that older workers ignore the window and remove every match in each block they receive, without an error. The flags should only be used once every scheduler and worker runs 3.1.
TraceQL metrics, which became generally available in 3.0, gains three changes. The experimental hint with
(extrapolate=true)
scales by the sampling rate in
tracestate
. This follows OpenTelemetry's probability sampling rules. At 50% sampling, each stored span counts as two. Spans without a recorded rate count as one, so partial adoption does not distort other services. It applies to:
rate
,
count_over_time
,
sum_over_time
,
avg_over_time
,
histogram_over_time
,
quantile_over_time
, and
compare
, but not to
min_over_time
or
max_over_time
. It requires vParquet4 or later and reads the rate the same way as the metrics-generator's
enable_tracestate_span_multiplier
setting from 3.0, so ad-hoc queries and pre-aggregated series should agree. Second, +, -, *, and / now work between metrics queries and scalars, so an error rate becomes a single query. Third, the span-only fetch path, experimental in 3.0, is now on by default for vParquet5 blocks. In one warmed-up test,
{ } | rate()
finished in slightly over half the time.
Other additions include an experimental span pruning option on the trace-by-ID v2 endpoint, which collapses similar leaf spans into one summary span carrying count and duration statistics. The same endpoint gains TraceQL filtering. A new experimental POST /api/v2/traces/diff endpoint compares two traces and can return a compact summary instead of a span-level patch. It is exposed through gcx, tempo-cli, and the Tempo MCP server, where Grafana says the smaller payload helps LLM-driven investigations. The metrics-generator gets an
unmatched_span_kind
label on expired service-graph edges, support for the renamed OpenTelemetry db.system.name attribute, and pooled label buffers that Grafana reports reduce per-span allocations to zero in its service-graph benchmarks.
منتشرشده در
InfoQ
ادامه مطالعه
 Netflix TechBlog