Skip to content
GL

Grafana Labs Blog

مشاهده‌پذیری با Grafana، Loki و Tempo.

۱۱ مقاله۰ دنبال‌کننده#دواپس و SRE
GLGrafana Labs Blog

Take Grafana Labs' 5th annual Observability Survey

Over the past year, "agentic" has gone from an emerging buzzword to an integral part of worklife for many engineers—and that's just scratching the surface on all that's changed. With so much upheaval, there's never been a better time to capture the pulse of the industry, which is why we want you to take Grafana Labs'…

هوش مصنوعی۲ دقیقه مطالعه
GLGrafana Labs Blog

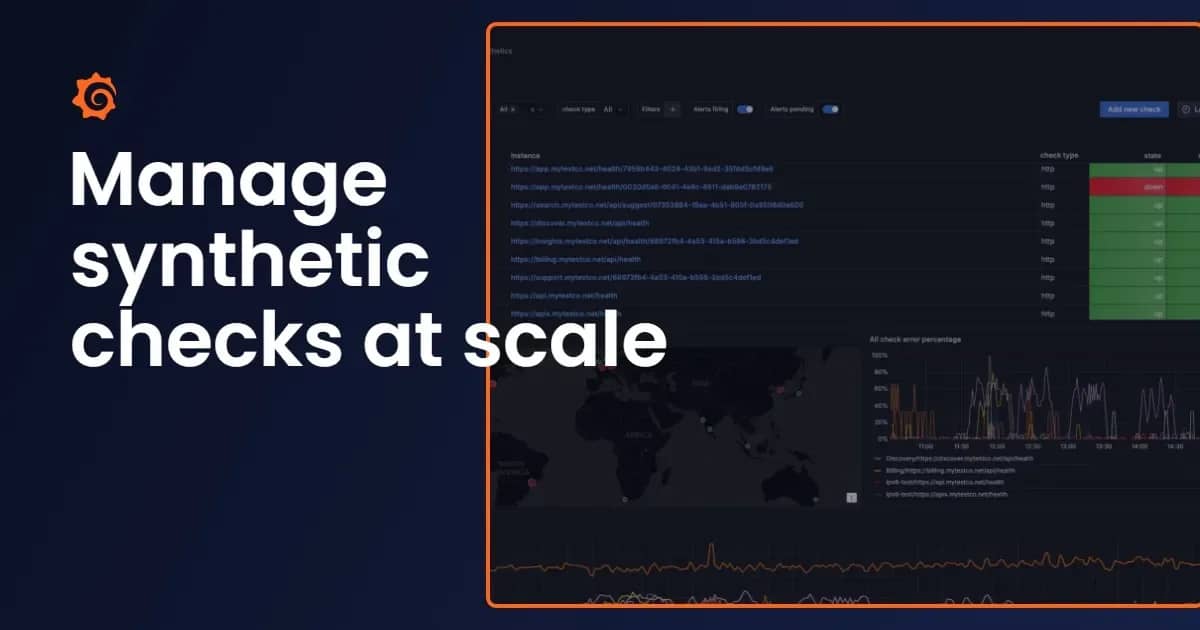
Manage synthetic checks at scale: Introducing folders in Grafana Cloud Synthetic Monitoring

As your use of Grafana Cloud Synthetic Monitoring grows, so does the number of checks you need to manage across services, environments, and teams. Eventually, a single flat list of checks becomes difficult to navigate, and even simple questions get harder to answer: Which checks belong to the payments team? Can I…

ابر و زیرساخت۵ دقیقه مطالعه
GLGrafana Labs Blog

Grafana Alerting: Scale alert routing without scaling complexity using multiple notification policies

Alert routing often starts simple. A team creates a few contact points, adds some label matchers, and builds a notification policy tree that sends each alert to the right destination. But alerting configurations rarely stay simple. As an organization grows, its notification policy tree must accommodate more teams,…

دواپس و SRE۷ دقیقه مطالعه
GLGrafana Labs Blog

Digital Experience Monitoring with Grafana Cloud: Session Replay, synthetic checks, and faster investigations

When something breaks in production, the questions that matter most are also the toughest to answer from metrics alone: who was affected, what did they actually see, and is this worth waking someone up for? Answering those questions requires a fuller picture of the issue and its impact on your users. That’s where…

توسعه وب۶ دقیقه مطالعه
GLGrafana Labs Blog

Custom labels in Grafana Cloud Synthetic Monitoring: New updates for consistency and ease-of-use

Labels are a powerful way to organize telemetry and define policies across Grafana Cloud, helping to streamline alerting, attribution, access control, and more. But traditionally, custom labels in Synthetic Monitoring have worked a little differently: they only lived on a single sm check info metric, and Grafana…

ابر و زیرساخت۴ دقیقه مطالعه
همه را دیدید ✓