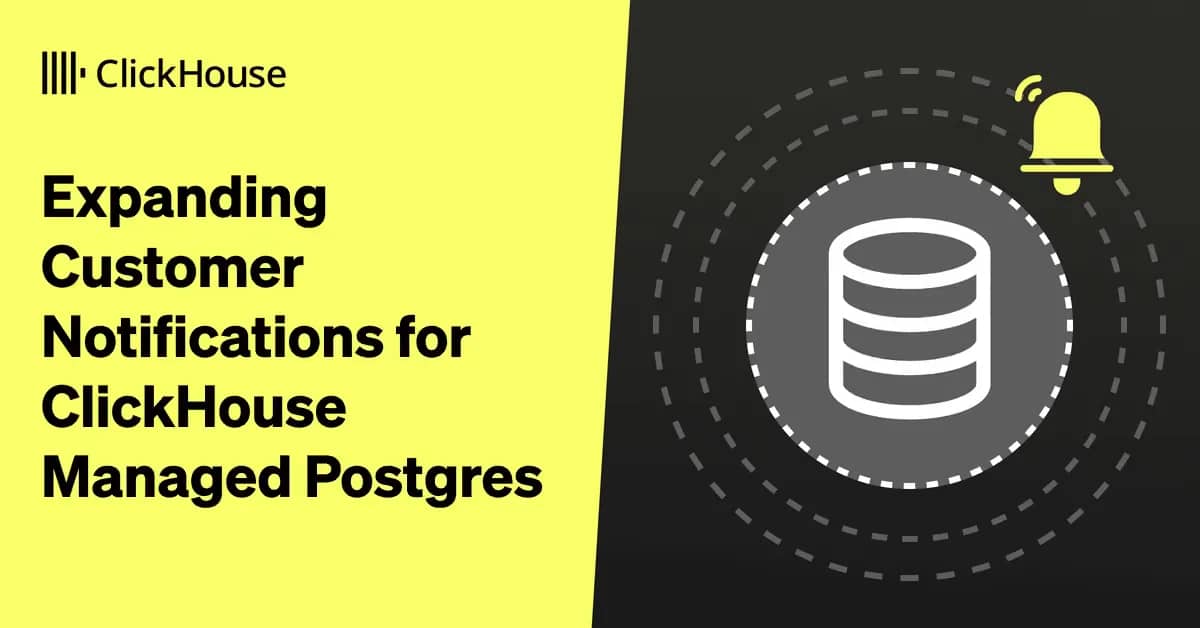
Presentation: Wrangling Telemetry at Scale: A Guide to Self-Hosted Observability
Colin Douch shares battle tested strategies for building and scaling self hosted observability stacks. He explains how to effectively correlate metrics, structured logs, and distributed traces using open source tooling like Prometheus, VictoriaMetrics, and Jaeger, while navigating the engineering trade offs of…
Transcript
Colin Douch: Do you ever feel a looming threat of complexity? I feel as I've developed in my infrastructure life, I've developed the ability to almost smell it. It feels like even in simple systems, we're always fighting this uphill battle against this ever-encroaching demon. It's so easy to make something complex, and sometimes that complexity is out of necessity. Our world is complex, so our systems must sometimes also be complex. Sometimes it's out of false necessity. I thought it needed to be complex, or perhaps these days my AI thought it needed to be complex. Sometimes it's out of organic growth. Something started simple and became more complex over time. Sometimes it's just out of a lack of care. No matter what, we live in a world of complexity. For those of us who have to build, run, and operate these complex systems, tough luck, like that's our collective punishment for sins in a previous life.
There's a few escape hatches that sneaky folks like us like to run to when we try and escape that complexity beast. We can scoff and decide to rewrite it. Surely if we rewrite it, then all of the complexity will fall away and reveal the soft underbelly of a simple system that does all the things the complex one did with none of the complexity. Or we might try to ignore it, put it in a box, shield it from solar rays and funny looks, and try not to think about it. Or if we have to touch it, we might fob it off onto whoever is unlucky enough to be our next hire. Increasingly with distributed systems, our old methods don't work. These things become too large to rewrite, too complex to throw in a corner, and so scary that if you gave them to a new hire, they might just run away.
In those scenarios, when we have to stop running and actually have to start to tame the complexity that has been wrought upon us, we have to turn to observability. I often get asked by engineers, because I do have some experience in this field, should I run my own observability stack? My answer is, no. You don't need that hassle. In fact, I think you should put as much effort as you can possibly muster into fighting the urge to do so. You see, it's that complexity demon again. He's invading your mind. As soon as I say that, I often get a Datadog bill or a Splunk bill thrown in my face. Can people stop doing that? I have so many paper cuts on my face. How many folks out there spend at least part of your day trying to tame a Datadog or a Splunk bill? That's crazy that that's something that people have to do.
Doesn't the thought of just chucking Prometheus and Grafana on a $10 a month VPS sound so alluring? No. Back, complexity demon. There is a reason that even in the face of those monumental bills, I will say, do not run your own thing. I will recommend that you stick with a provider. That doesn't mean not changing a provider. You can certainly do better than Datadog and Splunk these days. Please, unless you need to, buy your way out of this problem, you'll save yourself so many gray hairs and so much alcoholism.
There will come a time when your life starts to go downhill where you do need to start doing things for yourself. That billing thing is a real problem. It does get exponentially worse as your telemetry volumes get bigger and you outgrow your providers, or perhaps auditors are coming around asking tricky questions like, why do we shovel so much data to this random third party? Or maybe you've decided your BI folks need a feature that you don't have the clout with your SaaS provider to build for you. Or maybe that complexity demon has finally just sapped your will to live. As complexity starts to consume the systems we run, so too does it consume our observability itself. That's what I want to talk about today. How can we run our own observability stack? What does that look like? What are the tradeoffs? How can we weave a bunch of disparate tooling together into one debugging canvas?
Background
I'm Colin Douch. I, at the moment, am a site reliability engineer at DuckDuckGo. Before that, I created and then co-led the observability team at Cloudflare. Before that, I was a founding member of the SRE team at Xero doing cloud accounting stuff, doing basically the same observability work. Before that, I was doing observability work in the real-world mining sector. DuckDuckGo in particular has been a real trip, because DuckDuckGo still uses Carbon, and Graphite, and Icinga 1, not Icinga 2. Using that to provide observability into a massive Perl monolith has been a challenge, to say the least. All that being said, I have quite a bit of experience building self-hosted observability systems. Today, I want to share that, what I've learned and how people can better build, maintain, and monitor the complexity that seems to have become inevitable these days. Whatever the reason, and there are a myriad, you need to be prepared for the baggage that building your own observability system comes with.
Be prepared to dedicate at least two to three engineers, that's at least to run it. Spend more time and money than you ever thought you would need to. Spend more time in GitHub Issue pages than you ever have in your entire life. Put in an amount of effort that would make you wistfully look at your Datadog bill like you're hoping your ex will take you back.
What Does a Self-Hosted Observability Stack Look Like?
What does a self-hosted observability stack even look like? For most people who haven't been indoctrinated into the all you need is tracing crowd, it's going to look like the three pillars. We're talking systems for metrics, logs, traces, but crucially, ways to tie them together. Observability is not about the data you're storing. It's about how you can move between that data to find what you want. That's the hardest part of building it yourself because there aren't any great open-source tools that allow you to do that, at least by default. No matter what, we're going to need telemetry storage. Let's talk about that. We can start with metrics.
Metrics
If I asked you, what should I use to store my metrics, what answers would I get? I imagine some of you are rolling your eyes and saying, Prometheus, obviously. The more well-researched or newer to the game might say, VictoriaMetrics smugly, and then put on a top hat and a monocle, and show how efficient it is, before laughing and cackling at the Prometheus people. The older folks might suddenly grow another wrinkle and say, Graphite, or RRD, or Carbon. In this instance, I think the Prometheus folks are right, but not for the reason you think. Don't get me wrong. As a time series database, VictoriaMetrics is just better. It just is. If you need a strict what you put in is what you get out type of database, VictoriaMetrics is lossy in that way, so maybe not. In terms of efficiency, in terms of scalability, in terms of ease of running, VictoriaMetrics is what we want.
That's just if you want metrics. We want observability. Prometheus has one feature that VictoriaMetrics refused to implement, exemplars. Exemplars are what allow us to start stitching together metrics into our other types of telemetry. You have to enable them in Prometheus with a feature flag at the moment. They are included in the OpenMetrics spec, the attempt to formalize the Prometheus text exposition. Hopefully that will change soon and everyone will be able to enjoy them. What exemplars allow you to do is attach a second labelset to your metric. The special thing is that that labelset can change but still be attached to that same metric, which allows you to provide an exemplar. For example, let's say we have this nice little error metric. He's running along, all good, no errors. Then suddenly, no, he's fallen over. No, we've got an error. This is standard monitoring. We know this.
Something went wrong, but we don't know what. We just got an error. If we're exporting traces or logs with a correlation ID, we can add that to the error metric as an exemplar. This trace ID is an example of a request that triggered this increase in the error metric. Now we have something to go on. We can start to move between systems. Grafana even has the ability to show these in graphs alongside the metrics themselves, which allows you to one-click jump from your graph that went wrong to traces that tell you why. If you go with Prometheus, eventually you're going to start hitting scaling issues. This is where the VictoriaMetrics folks like to jump back at me and get all smug and point out that VictoriaMetrics has a clustering which allows it to horizontally scale. Prometheus just doesn't. It doesn't horizontally scale at all, really.
It was built with this natural tree structure in mind, like one Prometheus server or a pair of them for redundancy for a set of servers. If you run out of space, you vertically scale or you shard it and split your metrics across different servers. Neither of which are particularly good solutions. Scaling up, you start to hit scaling issues, especially if you're on a cloud provider, pretty quickly. Sharding requires a huge amount of manual effort, especially when there's no natural boundary to shard on, because you then have to create another federated instance to share metrics. It becomes a huge mess.
It begs the question, how do you scale this thing? There are a few dimensions to consider. The number of active time series, which is the number of time series that have had a sample in the last two hours, and your retention, which starts to bound your CPU for queries and things like that. For your active time series, Prometheus buffers the last two hours' worth of metrics in memory, which is known as the head chunk before it's finalized to disk. Unfortunately, that's just Prometheus's design. There's not much you can do about it. At Cloudflare, we found that for each time series in that head chunk, it takes about 4 kilobytes, so use that for your capacity planning. What makes this a little bit easier and solves the retention issue as well is long-term storage systems. You can probably name a few: Thanos, Mimir, Cortex. They all serve to solve the retention problem in different ways.
Mimir and Cortex, through Prometheus's remote write system, directly writing metrics to a receiver service, which removes the need for that head chunk, and then writes them to blob storage. If you are running into head chunk issues, go there. Thanos, on the other hand, because it can only upload completed blocks, which are finalized every two hours, it relies on having to pull directly from the sidecars that run next to each Prometheus instance before it can run a computation, which tends to make highly distributed environments quite difficult with Thanos. There are a couple of tips here that I think, in the general case, make Thanos shine over Mimir and Cortex. The first is the distributed query engine. Usually, when Thanos does a query, it fetches data from all the sidecars and centralizes it and then runs the query over that data, which, if you're querying over a large number of data centers, is disastrous.
It's way too much data. If you use the distributed query engine with that flag there, it pushes that computation down into the sidecars, which then send partial results back and those get combined centrally, which, if you have the architecture to require it, a more distributed system rather than one or two data centers, this unlocks the ability to horizontally scale your Prometheus query layer, which is pretty great when it's for free. The other is the Parquet storage engine. One thing that's really frustrating about the Prometheus world is that Prometheus people tend to be very protective of Prometheus. I remember at PromCon, I think in 2017, 2018, when Alexander first announced VictoriaMetrics, and Brian Brazil and a couple of other maintainers threw together a very quick lightning talk that basically amounted to, no. So too today, because Thanos has a new neat little experiment they're running, rewriting Prometheus blocks into Parquet.
If you use it, the benchmarks are incredibly impressive. They take you to basically the performance of VictoriaMetrics, but without any of the micro-optimizations that VictoriaMetrics does, which is quite exciting. You can have a look at it there. It's just an experiment at the moment, but I'm hoping that maybe that will start to get pulled into Prometheus itself, maybe in Prometheus 3.
Logs
Enough about metrics. They're boring. They're so retro. What we want is logs. We want observability, these things. To me, logs are the most fun part of an observability stack. They're ubiquitous, and they're simple. Just about everyone has done a hello world, which is a log, albeit a terrible one. At the same time, a lot of people get logging wrong. Lots of companies will try and tell you, logs are bad, you should do tracing. There is some merit to that. There's that complexity demon raising his head again, because I can call println, or I can import 10 megs of OTel libs and use their convoluted APIs. I would argue that in most cases, if you can get away with logs, do logs. Here's how you do them right. For starters, as you get more and more loglines, finding things becomes harder and harder. Things like Elasticsearch excel at full text search, which makes this work.
Elasticsearch is commonly used for this sort of thing. Full text search is slow, and even with the indexing that Elasticsearch does, especially if you want to start introducing regexes and wildcards, it starts to fall down. The simplest example I can give is searching for user records. Let's say we're logging a user ID, and we want to search for user 20. This pattern is very common in nginx logs, for example, older things that don't structure logs. Let's search for it. Because we're doing full text search, we also get user 202 and 2070. We can chuck in some anchors and search for breaks between words, but then we start to hit other issues. What if other call sites structure the data differently and it starts to get messy? No, plain-text logs, they suck. What you want is structured logging. People equate structured logging with JSON, and that's what it boils down to these days.
Really, the difference is in the storage engine, rather than how that structure is ultimately produced. You need a storage that allows storing and indexing on those structured fields, ideally with support for dynamic schemas, so you don't have to define up front what your data looks like. Elasticsearch, again, was the go-to for this for a long time. Dynamic field support in Elasticsearch just sucks. You can only have a certain number of dynamic fields in your index before ingestion just stops, and you have to bump the limit in your YAML file. If you bump the limit too high, the performance of your Elasticsearch server just tanks.
I haven't used it, but from what I've heard, OpenSearch, Amazon's fork of Elasticsearch from when things started to go weird with their licensing, does this a bit better. There are more specialized log storage things that seem to fit the bill. The first real competitor to come out was Loki from Grafana, which flips the storage model on its head. Instead of storing one big indexed stream, like a standard database, Loki stores logs in individual streams with stream labels. If you're not a big fan of the whole cattle not pets thing, you could have a stream for Node, or Node and services, like a couple. Crucially, that's all the indexing you get with Loki. If you want a field to be indexed, you have to say that at ingest time, which basically brings us back to that full text search problem. Anything you didn't say you wanted to be indexed goes back into that full text search, which means that you either have to know what you want to search for ahead of time or suffer the penalty of full text search.
That's not very observability of you, Grafana. VictoriaLogs, on the other hand, does not have that limitation. It's a full columnar database like its metrics counterpart. If you're starting from scratch or looking to move, VictoriaMetrics would be my recommendation. Of course, you could just go with a dedicated columnar database, like inserting logs directly into ClickHouse and using SQL to query them, or a gateway like Quesma. Those tend to be a lot higher maintenance in my experience. If you're not already running one, it's not worth starting just to run your logging system. Cloudflare got away with this by having a whole dedicated ClickHouse team to run the stack for us. Not everyone has that luxury or the ability to poach half of ClickHouse Inc. Remember the complexity demon? You really do need a columnar database with support for dynamic indexing. The reason for that is inherent in observability itself. We don't know what we don't know. Having to decide ahead of time what fields to index just doesn't work when we start to look at those unknown problems.
Speaking of observability, how can we actually start using logs to answer those questions? We have to think about the usability of our data. A lot of time, logs are sprinkled around. We're like a chef, just sprinkling them in wherever you need one. That leads to this annoying situation where for a single error, you have a bunch of disparate logs that are all unordered and all just strewn about, like old clothes you can't be bothered to put away. What we really need is a way to tie all of those logs together into one event, which is where canonical logging comes in. I think Stripe came up with this idea originally. It's a really simple idea that bridges the way between logging and tracing. Instead of doing this, where we have a bunch of individual log calls, we instead collect all our fields into a context block as we go through a function.
Then at the end, or in Go's case in a defer func, we emit it as one thing. Instead of having a bunch of disparate logs, we have one log per block of work. With one logline, there's no chasing through different streams to try and find what you need. It's all just there in one event. Generally, we do this at the handle level. If your service is an HTTP microservice, or in some sort of logic or top-level function, like a processing function, if not. You can even be super fancy and generate a UUID and add it in. Look, we've got a correlation ID that we can add to our exemplars. Between structured logging into a proper columnar database and canonical logging, we have a pretty good way to debug individual services, which might be enough if that's your architecture. Remember that complexity demon? Fight it off as much as you can.
Tracing
If you must, and we're here to talk about distributed systems after all, we need to talk about how we can debug across multiple systems that all talk to each other. We need to talk about tracing, which is what we're all here for. This is the debugging distributed systems track after all. I hope I've made a case that you can actually get pretty far with metrics, with exemplars, and canonical logs. As with so much here, keep fighting that complexity demon. Tracing explodes your complexity. Suddenly, you have to decide what tracing libraries to use. You have to worry about how you're going to export your data and in what format and what context format you're going to use, and how that gets serialized and deserialized between your systems and your RPC. There's a little secret here, one that tracing advocates don't want to tell you. Tracing is only tracing if it comes from the distributed tracing region of San Francisco.
Anything else is just sparkling logs, because that's really what they are, just logs with a little bit of structure dictated on top of them, rather than being arbitrarily freeform. Take a structured log, add a random ID, we'll call it a span ID, shall we say. Add a couple of passed in IDs, one that represents the request, we'll call that maybe a trace ID. We'll generate another one that we take in, and we'll call that the parent span ID. We've got a span. We collect a bunch of those spans together based on that top-level request ID, and we've got a trace. Why is tracing important? It's because of those parent-child relationships. It's a simple idea, but a pretty crucial one. Logs come in and get ordered by time, but on computers, time is weird and flexible and sometimes goes backwards, which is a crazy thing that time can do.
There's no real guarantee that a log coming in was actually produced before another log that came in later. The idea of a parent span ID strips that causal relationship there and models what we actually want. This function called this other function, rather than having to infer that based on temporal information. Having that alongside the wide context is tremendously useful in debugging, especially when you can communicate those IDs over a network between services, and stitch together spans from all over the place where those time issues become infinitely worse.
Because tracing has become this hot buzzword, there are so many tools that have popped up to try and be the one to take, process, and store your traces, which brings me to OpenTelemetry, or OTel. OTel, the spec, and the associated libraries attempt to try and mask over that complexity demon that is inherent in tracing. The OTel libraries make sane default choices for you so that if your entire stack is using them, they just work masking over a lot of those choices. Useful if you're just getting into tracing and you don't really care, or if you're instrumenting multiple different services in multiple languages and want to make sure that you've made the same decisions in each one. It's worth mentioning as an aside, OTel also has a spec for metrics and logs, but there's a reason I haven't mentioned them until now. I would recommend you don't use them.
Remember that complexity demon? Don't make things any more complicated than they need to be. The OTel project attempting to ingratiate themselves into existing open-source communities like Prometheus has caused quite a stir because they're completely ignoring what exists and just trying to dictate a spec. I highly recommend looking at the Prometheus mailing list for all the OTel discussions, if you need a dose of cortisol in your system, because it's quite a read. I would recommend the OTel libs for tracing. They're the most stable of the telemetry types, and the complexity they introduce becomes worth it because tracing is so useful. There are older alternatives out there. You can instrument with Jaeger or Zipkin, but both of which are older and being deprecated or are deprecated in favor of the OTel format. OTel is really your only choice here.
It's all well and good exporting a bunch of data. A lot of people just import OpenTelemetry, chuck in a bunch of auto-instrumentations and call it a day, but we're doing observability and observability isn't about collecting a bunch of data. We actually care about being able to use that data to solve problems. We want to store it and we want to care about what that storage can provide us in terms of useful queries and links to other systems. Yet again, we have a few options here, mostly Jaeger or Tempo. In the past, I would have recommended Jaeger as the original, but I think Tempo starts to tip it over because it starts to provide those observability features. Jaeger has made some impressive strides here. The new monitoring page in Jaeger, which I'd recommend you upgrade to, provides RED metrics for free from your tracing data. When it actually comes down to getting actionable insights out of your data, Tempo wins every day.
It actually has a bunch of features that make it quite useful. Things like TraceQL is tremendously powerful for searching through your spans. The ability to generate metrics from your traces is fantastic to enable those cross-telemetry bridges. The main problem I have with it is that it uses its own storage engine. From what I've seen, that doesn't scale well beyond a few tens of thousands of traces per second. Maybe that's just a me problem. Jaeger on the other hand, can scale as you go, which is why we went for it at Cloudflare. It's storage system agnostic, so you can start with Elasticsearch and then graduate to ClickHouse if necessary. Which provides a much nicer scaling path, but at the cost of losing out on a bunch of features, a lot of which we ended up implementing in our own private fork as much as I wanted to open source them.
Which is really frustrating because that's the point of tracing, collecting large amounts of data and then being able to sift through it. I really think there's an opportunity here for Jaeger to improve or a new system to blossom, because the lack of a fully featured scalable tracing system is probably one of the biggest downsides of the open-source observability world. The VictoriaMetrics folks are cooking up VictoriaTraces, which might be a solution here. It uses the same columnar DB as their logs offering, so provides that necessary wide event storage, but it's a little too new and untested for me to consider at the moment. Even though the point is to collect large numbers of wide events, you can't collect everything, at least not without bankrupting yourself.
We should probably talk about sampling. There are two types of sampling we can consider here. One easy, one more complex, head sampling and tail sampling respectively. Head sampling is a no-brainer. Probabilistically determine whether or not we should keep a span or a trace. Where this gets messy is when we then try and reason about our traces afterwards. For example, if we're only keeping 10% of our spans, we have to remember to multiply every stat we generate from those by 10. If we then change that ratio, we have to remember when we changed that ratio and apply different multipliers at different times. The hack here, if you're doing head sampling is to embed the sampling rate into your spans itself, so your query engine at query time can do that multiplication in line, which is quite useful. In a proper columnar database, because those numbers don't change very often, they compress to basically nothing.
Tail sampling is where things get interesting and messy, to the point that I would actually recommend against tail sampling, unless you are starting to get into the types of issues that head sampling causes. Tail sampling adds a little bit more logic to the flipper coin and choose whether you accept a span or not. Instead, we put an if statement in the mix. If it's an error, sample it at this rate. If it's not an error, sample it at a different rate. Useful if your errors are being drowned out by the noise of all your successes, which is a nice problem. There's that complexity demon again. Tail sampling requires you to have somewhere to buffer a trace because you don't know until all the spans come in whether or not something is an error. It requires you to have that resource usage that comes with buffering things and complexity and hard decisions, like how long to buffer for, which there is no real answer to because it entirely depends on where all your spans are coming from, and how to shard your traces so that all the spans from one trace end up on the right nodes so you can make the decision with all the data is a giant mess. Generally, if you are trying to host your own tracing system, I would recommend against it unless you are hitting tens of thousands of spans per second level. If you are considering it though, all of those sampling decisions we just talked about have to happen somewhere and that somewhere is a telemetry pipeline.
One of the most annoying things about modern observability in general is that because it pushes you to higher cardinalities and higher rates of data, that implies higher processing, and that processing has to happen somewhere. Generally, it means you're running a collector of some kind that takes your telemetry, runs logic over it, transforms them, drops them, that sort of thing. In the old world of logs and metrics, we can get away with just shipping things to the backend. Not so much these days unless you want your budgets to run away from you. You need some sort of processor. Again, a few options here. OTel itself provides one, the OTel Collector written in Go. Grafana Alloy is similarly based off of the OTel Collector. Vector recently acquired by Datadog, so take what you will from that, but written in Rust. Again, it starts to get messy. I love the OTel project.
It's a great effort. The idea of standardizing all of your telemetry formats so you can move between providers is a noble one even if it doesn't work in practice. The OTel Collector is a bit of a mess. That's speaking as a contributor to it. Because it's run by the CNCF, there's a certain amount of bureaucracy involved. Because it's run by unpaid volunteers, even minor changes can take weeks. If you want timely changes, that requires you to fork internally and run your own builds of a collector. It's a real pain point if you actually want to manage one. I'm not sure, at least until the components start to get a bit more stabilized that I can recommend running it. You've got a lot of data, lots of it. Data isn't observability, like a warehouse full of unlabeled boxes isn't a library. A Grafana instance full of graphs that no one understands isn't a debugging tool.
UI - Tying It All Together
The last thing we need is something to tie it all together. Something that we can actually use to solve problems. Generally, that comes in the form of a UI, because fortunately AIs and APIs haven't taken over the world quite yet. Again, Grafana may seem like the optimal choice here, or perhaps the only choice, save for those individual UIs out there. I would present you with another, Perses. It's a CNCF project that is designed to try and be a bit more of a user friendly and open-source friendly version of Grafana. Grafana in particular has the annoying problem of being owned by a company, which unfortunately in our capitalist society means they have to make money, which I mean, fair dues, no problem with that. I acknowledge the realities of our society. In pursuit of less, they end up locking a bunch of features behind paying them money.
Features that are really useful for making a better observability system, like usage tracking on certain dashboards or proper data source permissions. Even when folks try and contribute those features open source upstream, they get shut down. It's a bit disappointing. On the other hand, Perses provides all those features along with a few others, like better support for automated dashboards and things like ephemeral dashboards, dashboards that disappear after a certain amount of time. Because I think that's actually something a lot of people get wrong with dashboarding in particular. I've seen Grafana instances with thousands of built-up dashboards, copies of copies of copies of minor things changed. Because Grafana locks down those features behind its paywall, then most self-hosting people are not going to pay. You can never be quite sure whether a dashboard is safe to delete. I think there's an interesting distinction to be made in your dashboarding about two different use cases.
You have your BI dashboards. The ones that tell product folks things that keep the business going. How many users are there? Your click-through rate for things. Even your SLOs are a BI dashboard to some extent. These tend to be much longer lasting because business metrics don't really change that much. Then you have debugging dashboards. These display things like service metrics, specific drill-downs on known failure modes, things like that. I hate these because they tend to just stick around despite the fact that when you're debugging a problem, it tends to be different each time. If they're not, that's another question to ask yourself. Why are you getting the same problem over and over again? I would encourage you if you're running a dashboarding solution to go and tag each of your dashboards with one of these two labels and then audit your debugging dashboards for deletion.
It'll make it so much easier to use, which brings me back to Perses. Ephemeral dashboards automate that whole process for you. No manual cleanup required. They can get automatically deleted after a certain amount of time. They can even be automatically created by your alerting tool via webhooks specifically for any firing alert. Once you've got everything flowing together, we have to have to start thinking about how all this data weaves together into a cohesive structure. That all stems from our correlation IDs or trace IDs, if you're doing tracing. You see, by embedding those into our metrics with exemplars into our canonical logs as a context field and into our traces, we start to get this neat flow where our telemetry data merges together. This becomes a typical flow. Your alert fires, you have a metric spike. You picked Prometheus, so you have an exemplar on that metric, a trace ID attached to an example request that triggered it.
You click through to Tempo or Jaeger, you're now in a trace. You can see exactly what service in your distributed system starts behaving. You can see what downstream calls it caused. Because you've instrumented canonical logs, each span has a corresponding single logline. If you put enough context into them, because we all love high context as we should, you can see exactly what failed where.
What About the Future?
What about the future? Because observability stacks do have one thing, multiple separate tools do kind of suck even though you can make them better by weaving them together. There's a lot of duplication when you have multiple different systems, because what you really have is metrics, logs, and traces. It's the same data with different granularities. Your logs are basically subsets of your traces, and your metrics are just counts and aggregations over them as well. Effectively, if your traces are good enough for the wide enough context, you don't actually need to generate the others in your application because you can synthesize them in your observability tool. It means that one instrumentation of your wide events just gives you the rest of the telemetry. There are starting to be tools that do this well. SigNoz for one does an ok job at being an all-in-one solution, although it suffers from the problem of doing everything fine and nothing great.
Your pipelining tools are starting to develop these features as well with OTel Collectors connector format, and vectors log to metric function to do similar. I think the key thing here is that logs and metrics aren't going away. They're just changing. I do see a future where in the open-source world, not just the SaaS world, you only have to instrument your applications once with these wide high-context events. From those, all your other types of telemetry are derived. Metrics for graphing and alerting, logging for debugging and tracing for locating problems, all just the one original source of data where the three pillars aren't gone, but they're instead pushed up the stack. In doing so all work in harmony on one grand observability canvas.
Questions and Answers
Liz Fong-Jones: You said that the state of open-source tracing tools is less mature than the other signals. Why do you think that is? What can people do to solve that problem?
Colin Douch: There's a lot of aspects to a good tracing tool and a lot of open-source projects do some of the things required. Open-source contributions are always welcome. The CNCF Jaeger project is tremendous. Please go contribute, if you're welcome to it. The other upcoming things like HyperDX from ClickHouse and things like that are also worth keeping an eye on because they are up and coming.
Liz Fong-Jones: I noticed you didn't mention the word AI anywhere in this talk. What thoughts might you have about how can AI help us build or run these telemetry systems?
Colin Douch: I have a lot of thoughts around, especially like SRE workloads and AI because what it amounts to for AI observability at the moment is chucking a bunch of traces into a context window and hoping that something gets spat out the other end. There's work to do in distilling information before it hits an AI agent. AI agents are very useful at summarizing information, but especially with wide high context events, that context window gets burned very quickly. There needs to be some intermediate layer that helps in the meantime.
Liz Fong-Jones: You're saying that I shouldn't just shove an MCP server directly on top of the logging API and have it spit out 500 kilobytes of logs?
Colin Douch: You're welcome to try, but I'd love to know how much hallucination is there.
See more presentations with transcripts
منتشرشده در
InfoQ
ادامه مطالعه
 Stripe Blog